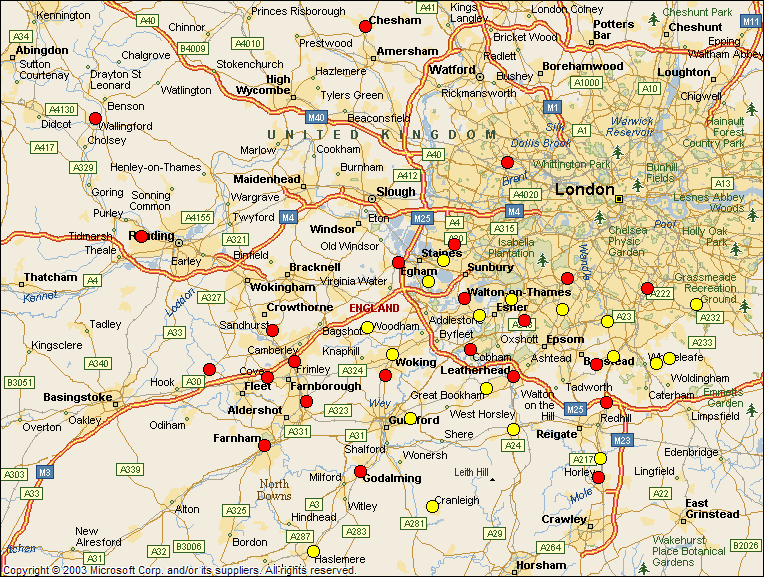
| Combined Counties Division One | |||||||||||||||||||||
| Team | Max | Min | Total | Bed | Boo | Cho | Con | Cra | Cre | Dit | Far | Her | Mer | Mon | Net | See | She | Sho | Sta | War | Wor |
| Bedfont Green | 39 | 3 | 388 | x | 24 | 14 | 27 | 32 | 18 | 8 | 39 | 7 | 22 | 33 | 34 | 27 | 14 | 36 | 3 | 38 | 12 |
| Bookham | 25 | 7 | 292 | 24 | x | 20 | 24 | 19 | 15 | 11 | 25 | 10 | 8 | 18 | 20 | 7 | 14 | 23 | 20 | 22 | 12 |
| Chobham & Ottershaw | 41 | 4 | 375 | 14 | 20 | x | 41 | 19 | 28 | 18 | 35 | 11 | 12 | 29 | 31 | 23 | 4 | 22 | 9 | 35 | 24 |
| Coney Hall | 53 | 9 | 440 | 27 | 24 | 41 | x | 37 | 10 | 20 | 9 | 23 | 39 | 20 | 10 | 23 | 41 | 53 | 40 | 9 | 14 |
| Cranleigh | 37 | 12 | 414 | 32 | 19 | 19 | 37 | x | 28 | 26 | 34 | 24 | 12 | 24 | 29 | 14 | 16 | 14 | 26 | 33 | 27 |
| Crescent Rovers | 40 | 3 | 289 | 18 | 15 | 28 | 10 | 28 | x | 11 | 9 | 14 | 22 | 12 | 3 | 14 | 27 | 40 | 26 | 7 | 5 |
| Ditton | 30 | 4 | 255 | 8 | 11 | 18 | 20 | 26 | 11 | x | 19 | 4 | 16 | 20 | 13 | 14 | 13 | 30 | 9 | 17 | 6 |
| Farleigh Rovers | 47 | 2 | 404 | 39 | 25 | 35 | 9 | 34 | 9 | 19 | x | 26 | 33 | 15 | 8 | 20 | 35 | 47 | 34 | 2 | 14 |
| Hersham Royal British Legion | 28 | 4 | 266 | 7 | 10 | 11 | 23 | 24 | 14 | 4 | 26 | x | 14 | 19 | 22 | 13 | 11 | 28 | 6 | 25 | 9 |
| Merrow | 39 | 8 | 339 | 22 | 8 | 12 | 39 | 12 | 22 | 16 | 33 | 14 | x | 27 | 29 | 12 | 8 | 16 | 17 | 33 | 19 |
| Monotype | 41 | 9 | 363 | 33 | 18 | 29 | 20 | 24 | 12 | 20 | 15 | 19 | 27 | x | 9 | 10 | 29 | 41 | 28 | 14 | 15 |
| Netherne Village | 43 | 3 | 341 | 34 | 20 | 31 | 10 | 29 | 3 | 13 | 8 | 22 | 29 | 9 | x | 15 | 30 | 43 | 30 | 6 | 9 |
| Seelec Delta | 27 | 7 | 287 | 27 | 7 | 23 | 23 | 14 | 14 | 14 | 20 | 13 | 12 | 10 | 15 | x | 17 | 24 | 22 | 19 | 13 |
| Sheerwater | 41 | 4 | 340 | 14 | 14 | 4 | 41 | 16 | 27 | 13 | 35 | 11 | 8 | 29 | 30 | 17 | x | 20 | 9 | 34 | 18 |
| Shottermill & Haslemere | 53 | 14 | 551 | 36 | 23 | 22 | 53 | 14 | 40 | 30 | 47 | 28 | 16 | 41 | 43 | 24 | 20 | x | 31 | 47 | 36 |
| Staines Lammas | 40 | 3 | 358 | 3 | 20 | 9 | 40 | 26 | 26 | 9 | 34 | 6 | 17 | 28 | 30 | 22 | 9 | 31 | x | 34 | 14 |
| Warlingham | 47 | 2 | 388 | 38 | 22 | 35 | 9 | 33 | 7 | 17 | 2 | 25 | 33 | 14 | 6 | 19 | 34 | 47 | 34 | x | 13 |
| Worcester Park | 36 | 5 | 260 | 12 | 12 | 24 | 14 | 27 | 5 | 6 | 14 | 9 | 19 | 15 | 9 | 13 | 18 | 36 | 14 | 13 | x |
| Overall | 551 | 255 | 353 | ||||||||||||||||||
| NB. All mileages are based on quickest driving times using Microsoft Autoroute | |||||||||||||||||||||
|
Combined Counties League |
|||
| Premier Division | Division One | ||
